Benefit Attributes and the Attribute-Score Comparison Chart
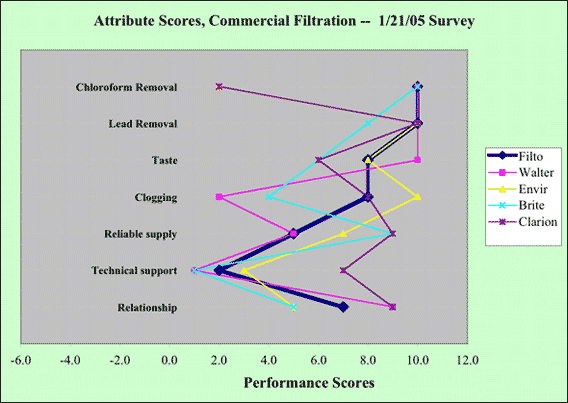
In the Customer Value framework, customer needs are described in terms of the attributes and benefits that customer look for in a product. Attributes include not only product and service characteristics, but also aspects of relationship and brand affinity that may affect the customer’s choice of supplier. Measuring customer value generally involves doing market research to find out what the customer wants, and to discover how customers perceive the different brands on the market. The Attributes chart shown below compares the scores of different brands on each of the benefit attributes.

Benefit attributes show what is important to customers
Spikes to the right identify a comparative advantage
Sometimes, most brands perform poorly
Performance scores are often measured on a 1-to-10 scale
Performance scores can be comparable on some attributes (lead removal)
Performance scores can be differentiated on other attributes (clogging)
Click on the buttons for explanations of the parts of the diagram.
